Keeping your server in a good state is very important, especially when you run a lot of services. You need to expect the unexpected.
Manage CPU and Memory Usage
It’s very crucial to check your CPU and memory usage periodically because sometimes, as it happened to me, I noticed my websites on my server were so slow. When I checked the CPU, I found it full. To check the CPU and memory usage, run the below simple command:
root@mail:~# topWhen the server was too busy, I got something like below. Pay attention to the CPU usage of 94.5%. It’s insane, and the websites were loading slowly. I was surprised because my VPS has no load and the websites on that VPS are almost new with low traffic. You can also see the memory usage. The process 62178 is consuming 29.6% of the memory, and the free memory is just 1024.8 MB out of 8 GB RAM.
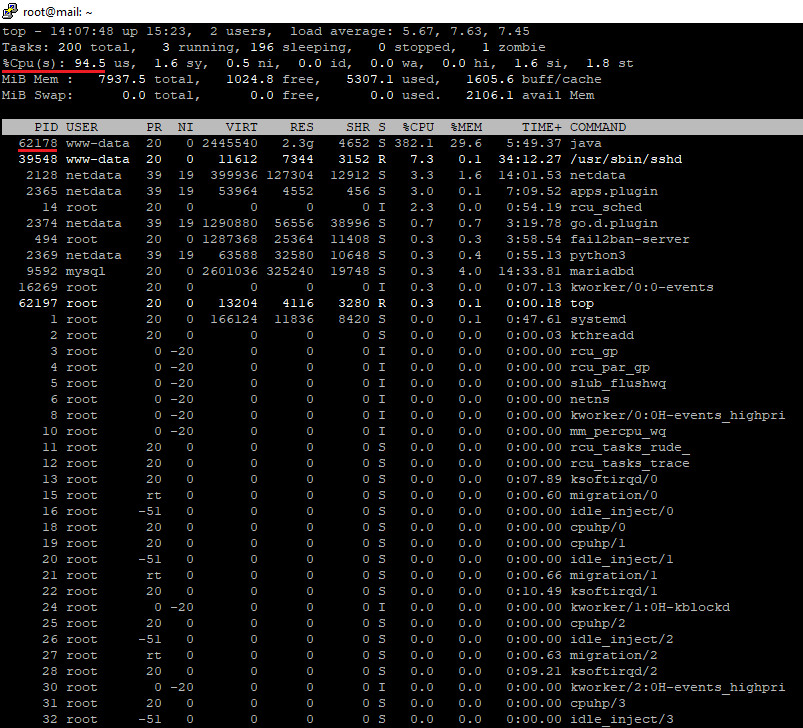
As you see, the process number 62178 (the Java process) is consuming 382% of the four-core CPU. When the CPU has multiple cores, you will see the usage for all cores. If the CPU has 8 cores, you will see something like 782%. I tried killing the process by running the command:
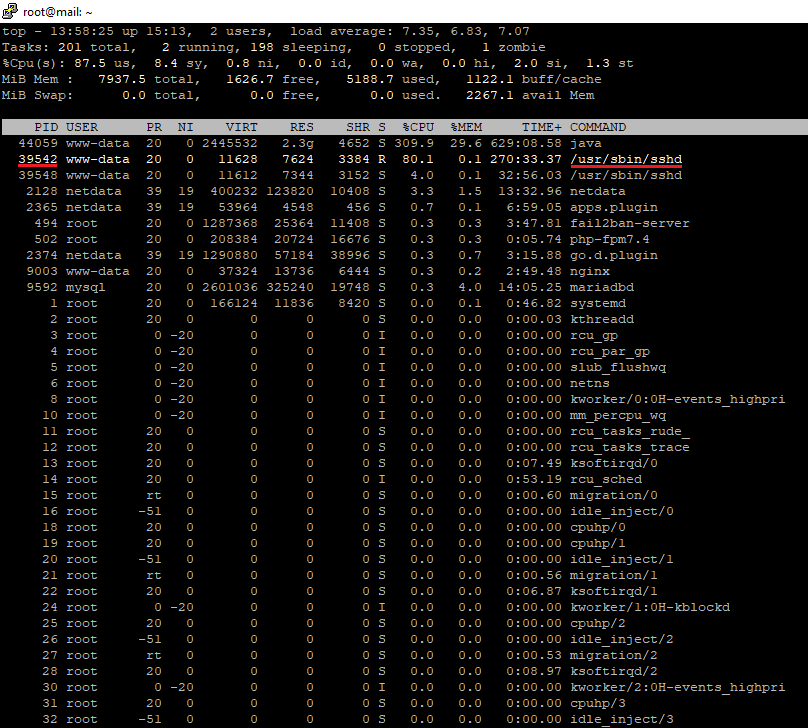
root@mail:~# kill 62178But unfortunately, it didn’t work. It generated again after killing. Also, I noticed there’s another process, 39542 (/usr/sbin/sshd), it consumes high portion of the CPU usage.
To know more about the process that was running by the www-data user, run the below command.
root@mail:~# ps -ef | grep www-dataYou will get something like this:
root@mail:~# ps -ef | grep www-data
www-data     539     487  0 Jan11 ?        00:00:05 php-fpm: pool www
www-data     540     487  0 Jan11 ?        00:00:05 php-fpm: pool www
www-data     547     485  0 Jan11 ?        00:00:05 php-fpm: pool www
www-data     548     485  0 Jan11 ?        00:00:01 php-fpm: pool www
www-data    1047     487  0 Jan11 ?        00:00:04 php-fpm: pool www
www-data   37259   25310  0 00:00 ?        00:00:18 nginx: worker process
www-data   42851     488  2 01:26 ?        00:00:43 php-fpm: pool inet
www-data   42852     488  2 01:26 ?        00:00:36 php-fpm: pool inet
www-data   42935     488  2 01:27 ?        00:00:28 php-fpm: pool inet
www-data   42974     488  1 01:28 ?        00:00:21 php-fpm: pool inet
www-data   43019     488  2 01:29 ?        00:00:30 php-fpm: pool inet
www-data   43026     488  1 01:29 ?        00:00:24 php-fpm: pool inet
www-data   43027     488  2 01:29 ?        00:00:27 php-fpm: pool inet
www-data   43030     488  2 01:29 ?        00:00:32 php-fpm: pool inet
www-data   43033     488  2 01:29 ?        00:00:33 php-fpm: pool inet
www-data   43085     488  3 01:30 ?        00:00:37 php-fpm: pool inet
root       44405   42416  0 01:51 pts/1    00:00:00 grep --color=auto www-data
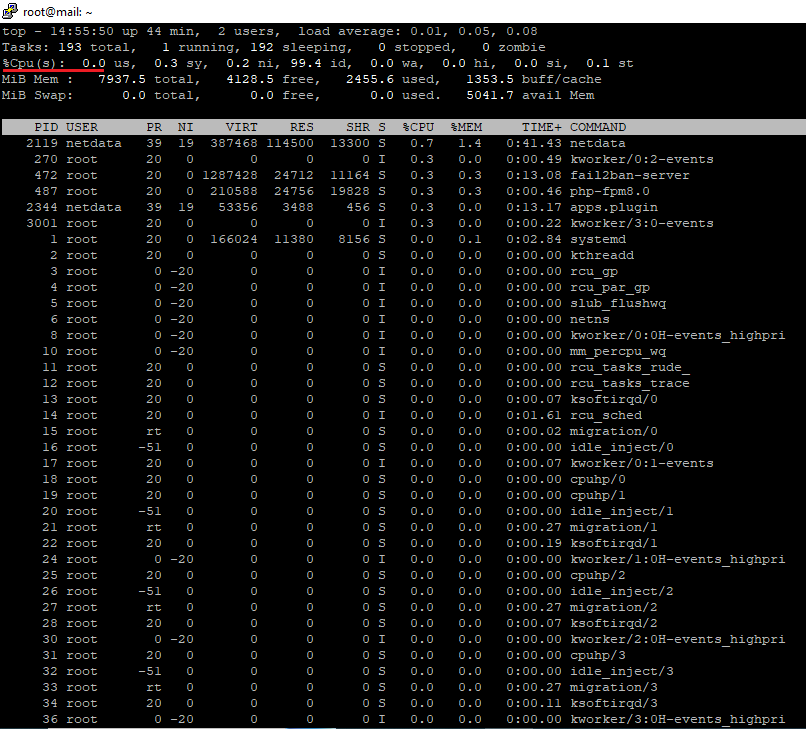
I had no info why these processes show up suddenly and slow down my server. I was thinking maybe because I rolled back my VPS from a snapshot. Another reason is that it could be due to the MySQL master slave replication process or maybe something related to syncing servers via the Rsync service, which runs every few minutes. Also, it might be an attack. The only solution I found that time is to reboot the VPS, which is impractical if this problem keeps persisting every once in a while. After rebooting, the CPU usage returned to almost zero for most of the time, as you see below.
To reboot your VPS, run the command. But make sure to take a snapshot before rebooting, so in case your server didn’t boot, you can roll back the snapshot.
root@mail:~# rebootFinally I was able to find the reason! It was because the file domain.com/xmlrpc.php was open!! And there were so many attacks on this file coming from java and usr/sbin/sshd process comands. I closed the file from the web server level and this problem never happened again. Now my server is running smoothly and fast all the time. Add the below directive in your Nginx virtual host file as below:
location = /xmlrpc.php {
        deny all;
}
The path for Nginx virtual host file for the domain is:
root@mail:~# nano /etc/nginx/sites-available/domain.com.confYou can read about a similar problem here.
The previous command was enough to check the important info about the memory. Also, you can run the below two commands:
root@mail:~# cat /proc/meminforoot@mail:~# free -mReduce Journal Log Size
To perform auto-maintenance, go to the file:
root@mail:~# nano /etc/systemd/journald.confThen, uncomment: #SystemMaxUse=, and change it to SystemMaxUse=100M
Restart the journald service to see the effect after step (a):
root@mail:~# systemctl restart systemd-journaldTo perform self-maintenance, run the below command for a two days retention.
root@mail:~# journalctl --vacuum-time=2dAnd run the below command to retain only the past 500 MB.
root@mail:~# journalctl --vacuum-size=500MYou can check the total disk space on your server by running the command:
root@mail:~# df -HStop Saving Mutt Messages
If you use Mutt, it saves sent messages by default. So to stop that, go to the file:
root@mail:~# nano /etc/MuttrcAnd add this line at the end of the file:
set copy=noThen, reload Mutt by running the command:
root@mail:~# source /etc/MuttrcSo these are the main steps. You can disable any service if it consumes the CPU. Also, check the crontab file, maybe there are some processes that consume the CPU. Open the crontab file by running the command:
root@mail:~# crontab -eSome of the services to consider:
root@mail:~# service netdata stoproot@mail:~# service fail2ban stop